How Walkable is New Lenox, IL?
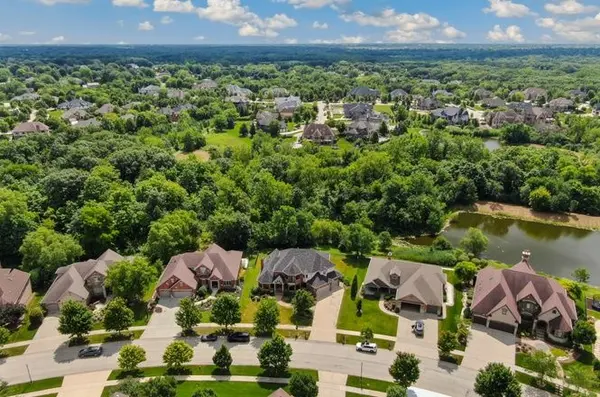
New Lenox, a growing suburb near Chicago, IL, has a Walk Score of 24 out of 100, making it a car-dependent community where most daily errands require driving. The village has expanded rapidly along the I-80 corridor southwest of the city.
Walkability in the Chicago area
The Chicago metro overall scores a 77 for walkability. New Lenox, at 24, falls well below that average. Among nearby Will County suburbs, Mokena (23) and Frankfort (19) score similarly, while Tinley Park (35) offers slightly more pedestrian access.
Chicago's Metra Rock Island line connects New Lenox to downtown in roughly an hour. Within the village itself, though, the road network is built for cars. Commercial areas cluster along Route 30, separated from residential subdivisions by wide arterials without sidewalk connectivity.
What a Walk Score of 24 means
New Lenox's Walk Score of 24 puts it in the "Almost All Errands Require a Car" category. Homes are typically set back from retail, with no practical walking route to shopping. The transit score is minimal, reflecting limited bus or train coverage within town. The bike score of 41 (Minimal Bike Infrastructure) means few dedicated cycling routes exist.
Why do buyers choose New Lenox?
New Lenox buyers are choosing space and value over walkability. The median sale price of $457,271 buys substantially more house than the same money would in a walkable Chicago neighborhood. About 52% of homes sell above asking, and listings move in 42 days, so demand is steady. Compare that to Evanston ($484,757), which has a Walk Score of 76 but offers smaller lots and older housing stock at a similar price point.
The tradeoff is direct: buyers accept car dependence in exchange for newer construction, larger lots, and lower density. New Lenox's housing stock is predominantly built since the 1990s, with modern layouts and attached garages. Walkability here means driving to a shopping center rather than walking to a corner store, but buyers get roughly twice the square footage they'd find in walkable city neighborhoods at this price. The 3.8 months of supply indicates a somewhat balanced market with more inventory than the tightest urban areas.
| Location | Walk Score | Bike Score | Transit Score | Median sale price | Days on market |
|---|---|---|---|---|---|
| New Lenox | 24 | 41 | -- | $457,271 | 42 days |
| Mokena | 23 | 37 | -- | $518,041 | 43 days |
| Bartlett | 22 | 49 | -- | $442,279 | 42 days |
| Algonquin | 26 | 49 | -- | $414,792 | 47 days |
| Round Lake | 20 | 39 | -- | $332,334 | 43 days |
| Grayslake | 28 | 44 | 21 | $402,299 | 43 days |
Limited to neighborhoods with at least 10 home sales in the period.
All data comes from Redfin and represents a three-month rolling average ending July 2026. This article has been generated, in whole or in part, using generative artificial intelligence (AI) technology, with input from Redfin head of economics research Chen Zhao. While efforts have been made to ensure the accuracy and reliability of this information, you should independently verify all data, facts, and citations contained in this article before relying on it for any purpose. This information is not a substitute for advice from a real estate agent, financial advisor, or other licensed professional. Check the Redfin Data Center for additional in-depth housing market data.
Categories
Recent Posts